What are Metrics?
All gamification features are centered around user interactions. At Trophy, we use the term Metrics to refer to the data objects that model those interactions within your web or mobile app. Metrics are un-opinionated, meaning they can be used to model absolutely any user interaction you can think of. Examples could include:- Followers, likes or posts
- Tasks completed
- Miles ran
- Lessons completed
- Words written
- …
Key Attributes
Here we describe the key attributes that allow you to create metrics to best fit your use case.Units
You can easily assign units to metrics in the dashboard for either:- Arbitrary numbers (tasks, posts, messages etc.)
- Currencies ($, £, €)
Creating Metrics
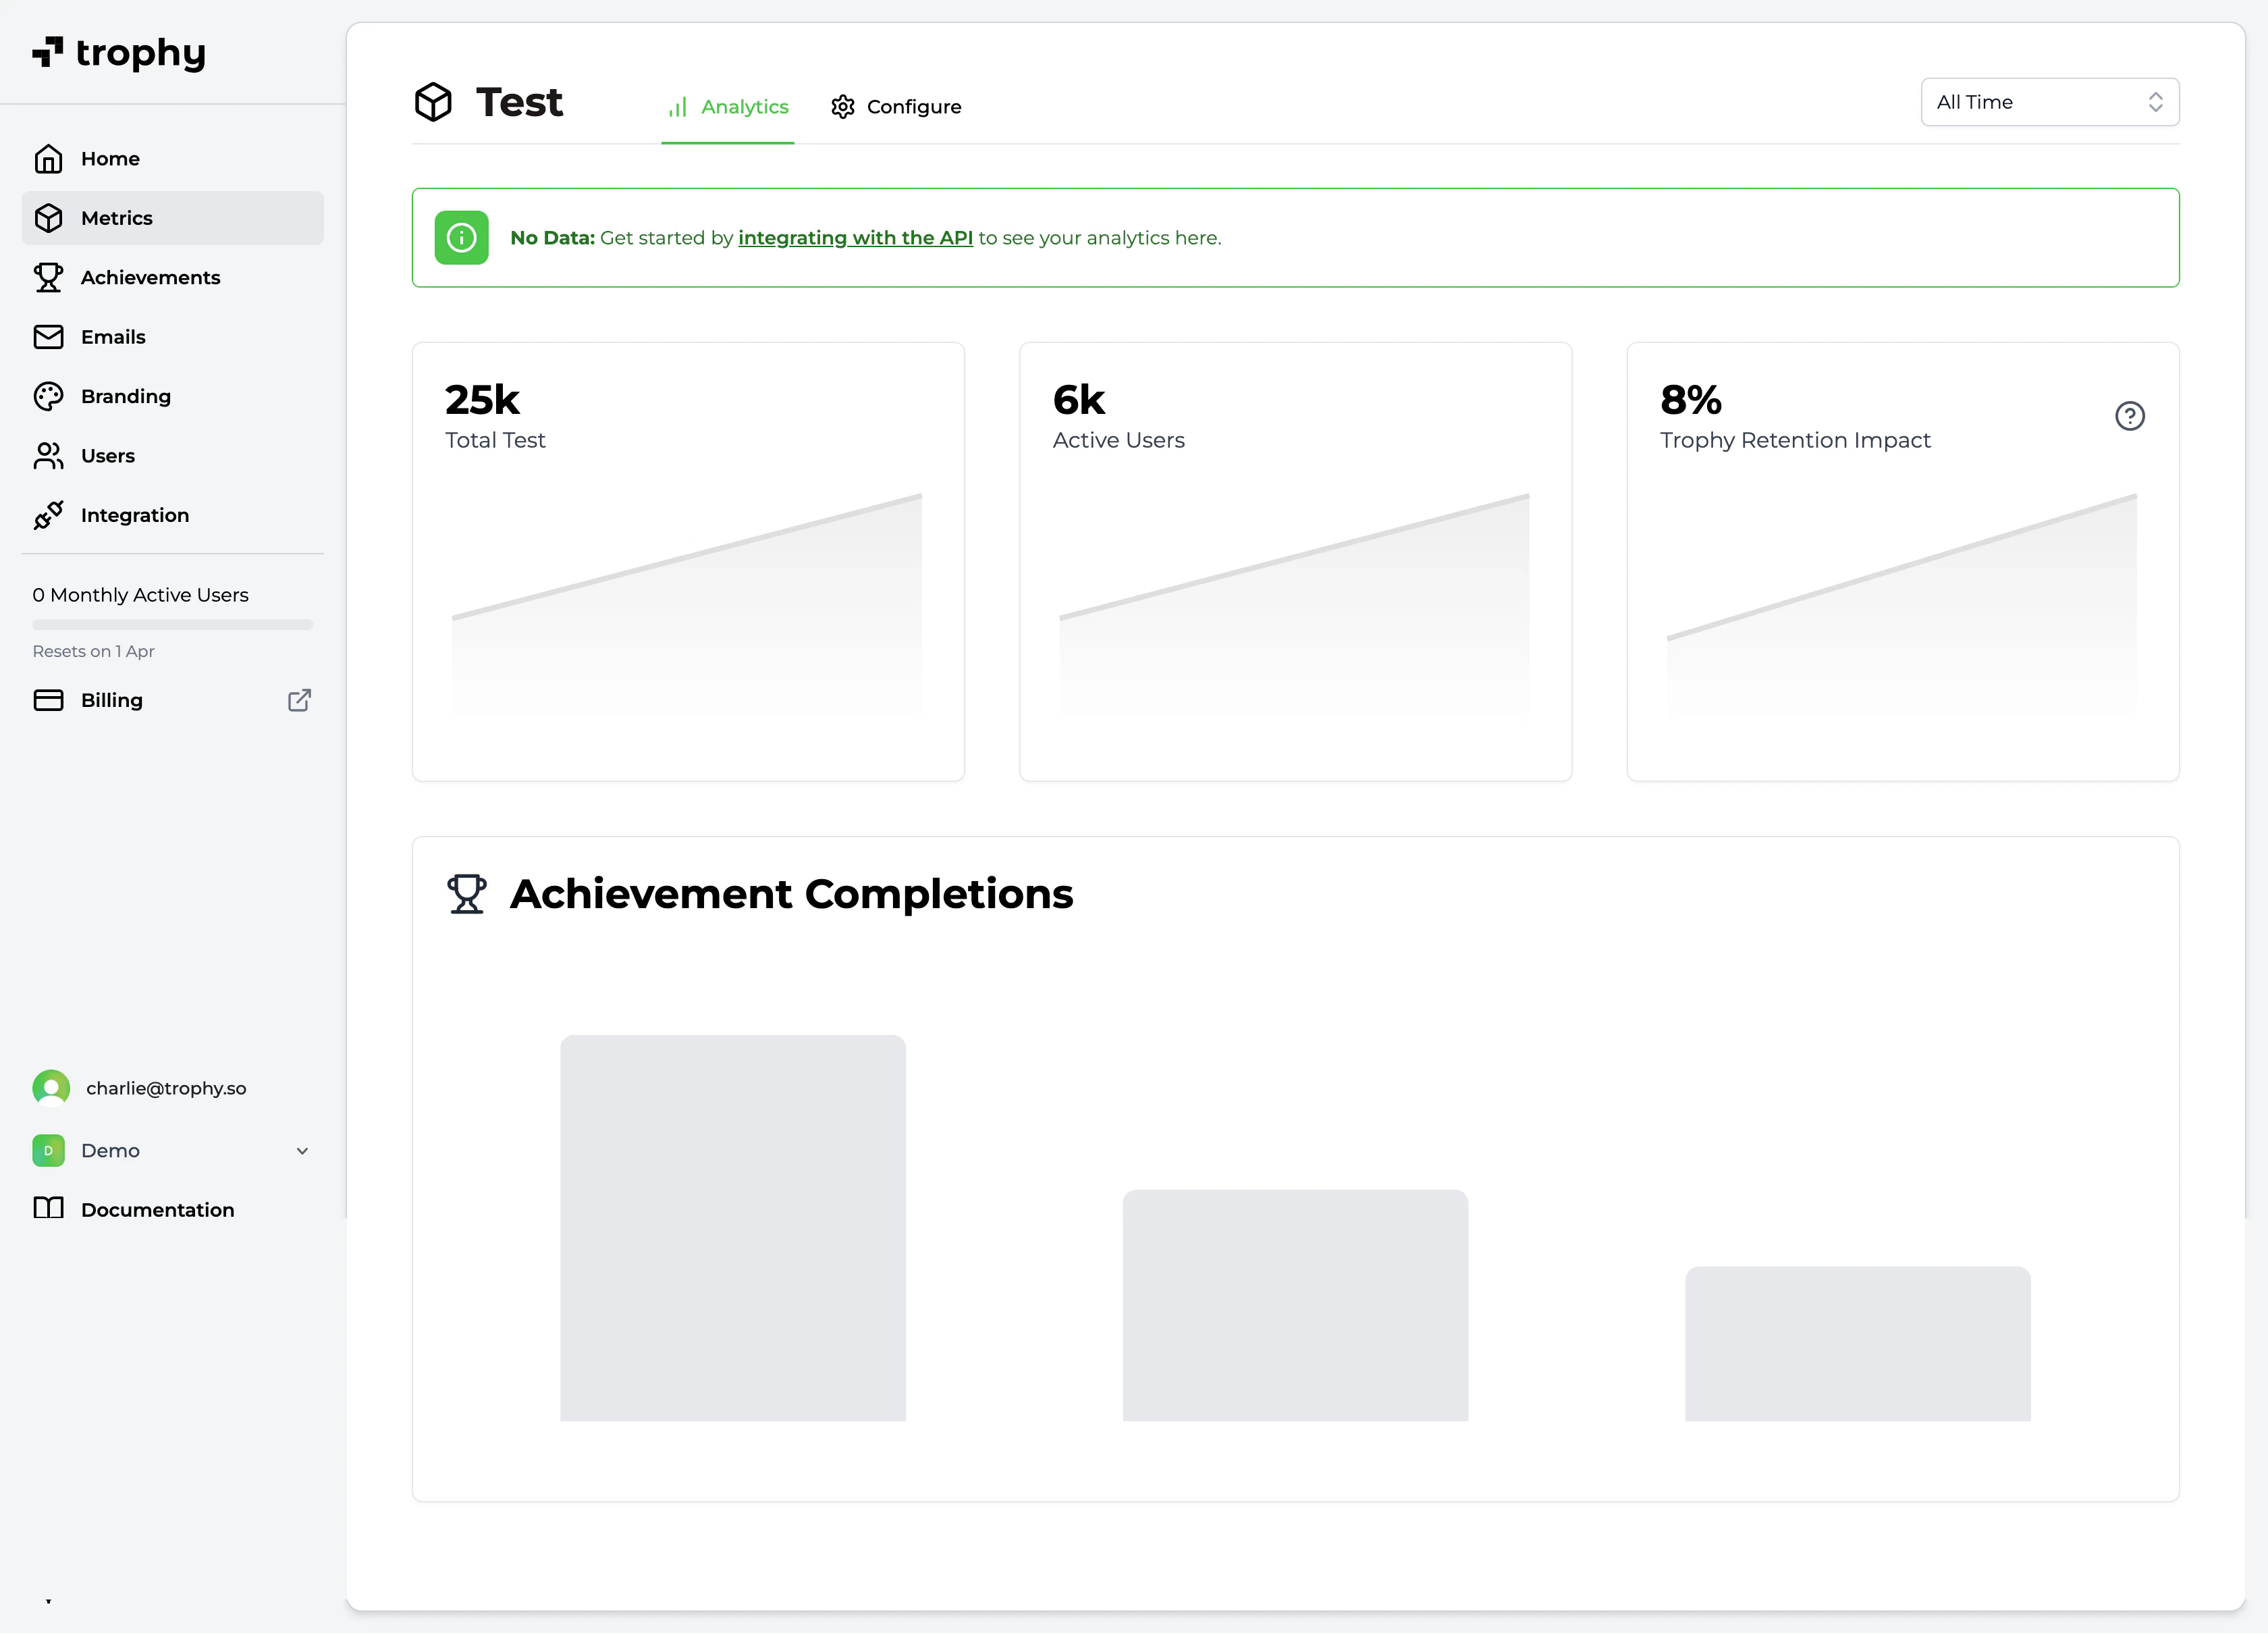
To create a Metric, head over to the Metrics page within Trophy and hit the New Metric button:Metric Analytics
Trophy has a built-in analytics dashboard for each metric you create. It shows you:- The total value of all tracked events against the metric
- The number of users actively making progress against the metric
- The metric’s Achievement Completion Chart
Achievement Completion Chart
The achievement completion chart shows the current state of the userbase in terms of the number of users who have completed each achievement that you’ve configured against this metric. Learn more about achievements.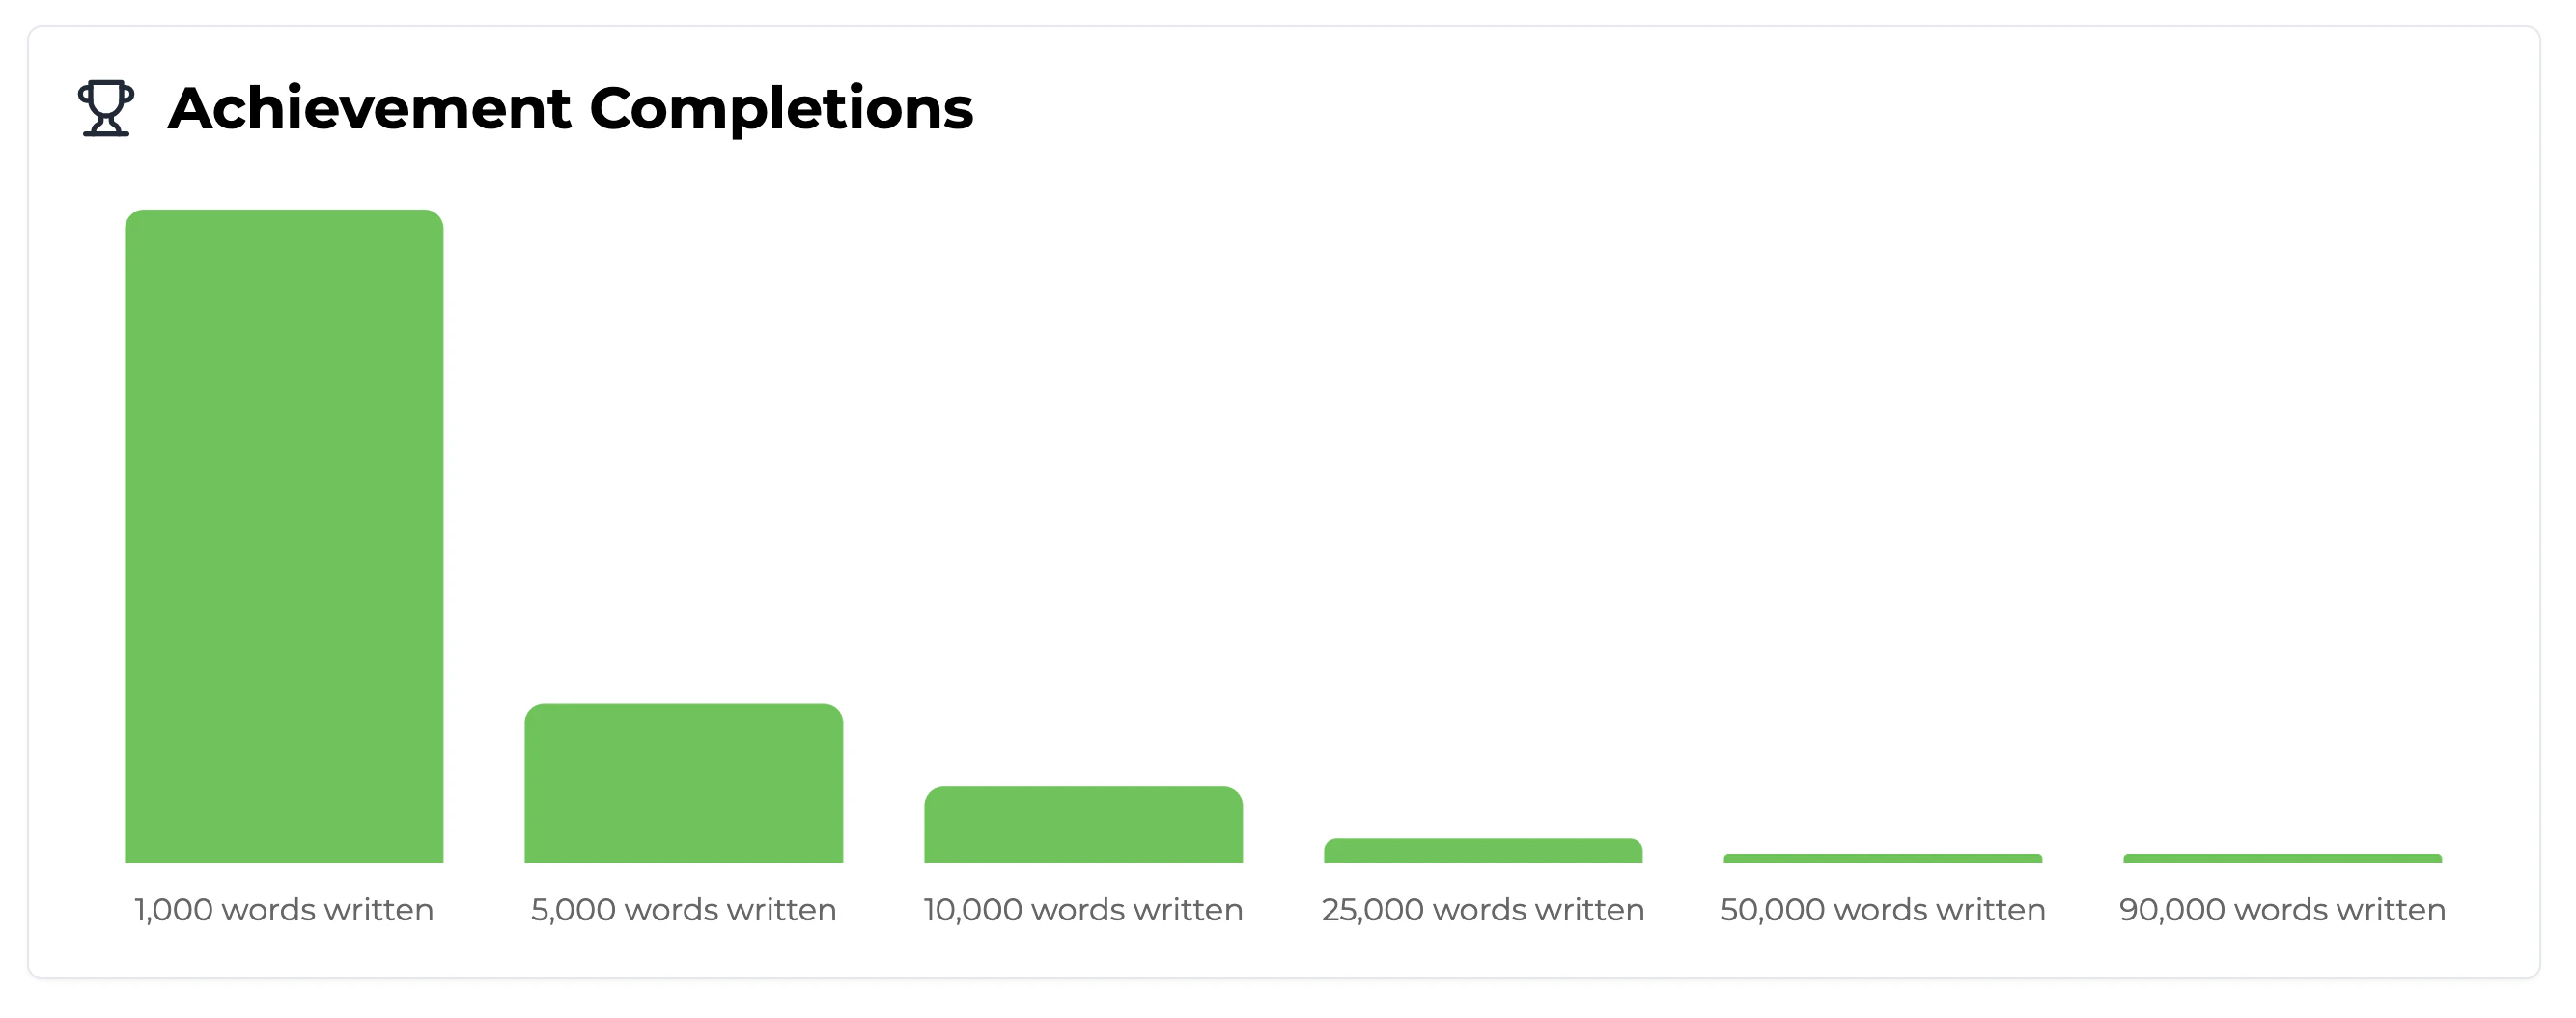
Frequently Asked Questions
How many metrics can I create?
How many metrics can I create?
As many as you want!
Can Trophy control my UI when events are tracked?
Can Trophy control my UI when events are tracked?
No, metrics are purely server-side and only support the business logic around achievements, streaks and other workflows like sending emails.They don’t control any in-app UI, but our APIs provide all the data you need to build whatever UI you want.